Figures
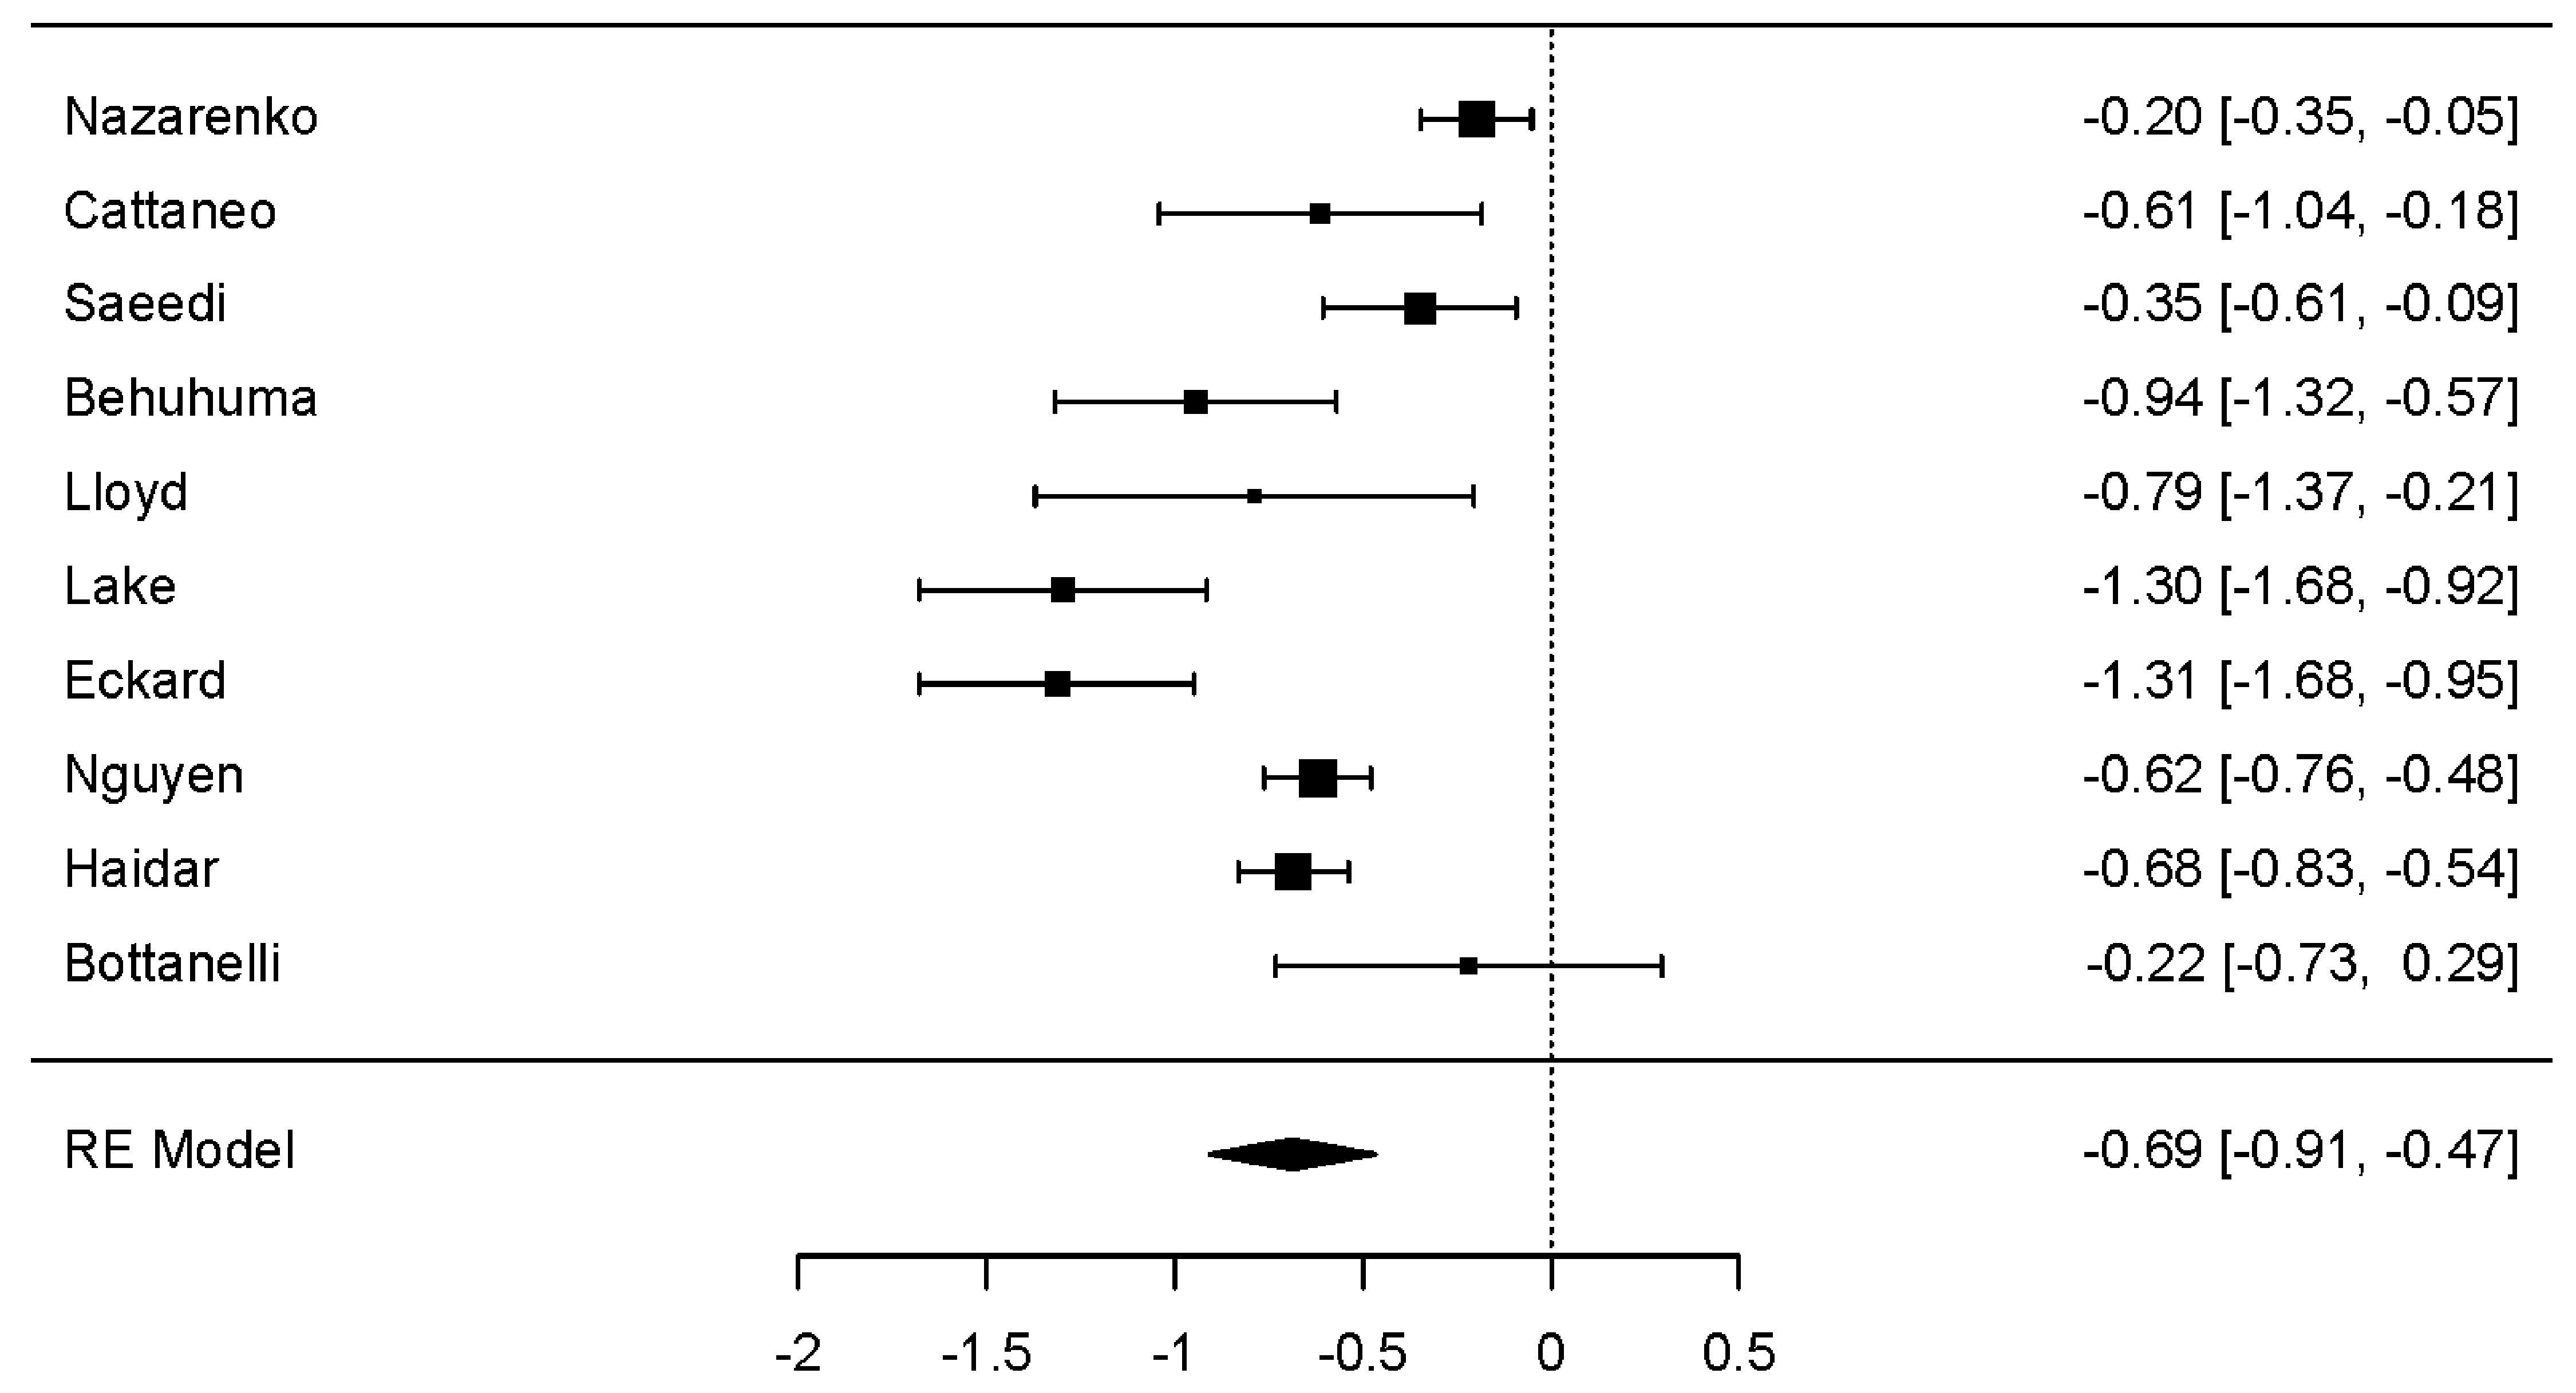
↓ Figure 1. Forest plot: weight change (kg). The
forest plot illustrates the random-effects meta-analysis model for weight change (kg) associated with
GLP-1 RAs among people with HIV. Values are presented as effect sizes (dunbiased) and
95% confidence intervals. HIV: human immunodeficiency virus; GLP-1 RAs: glucagon-like peptide-1 receptor
agonists; RE: random effects.
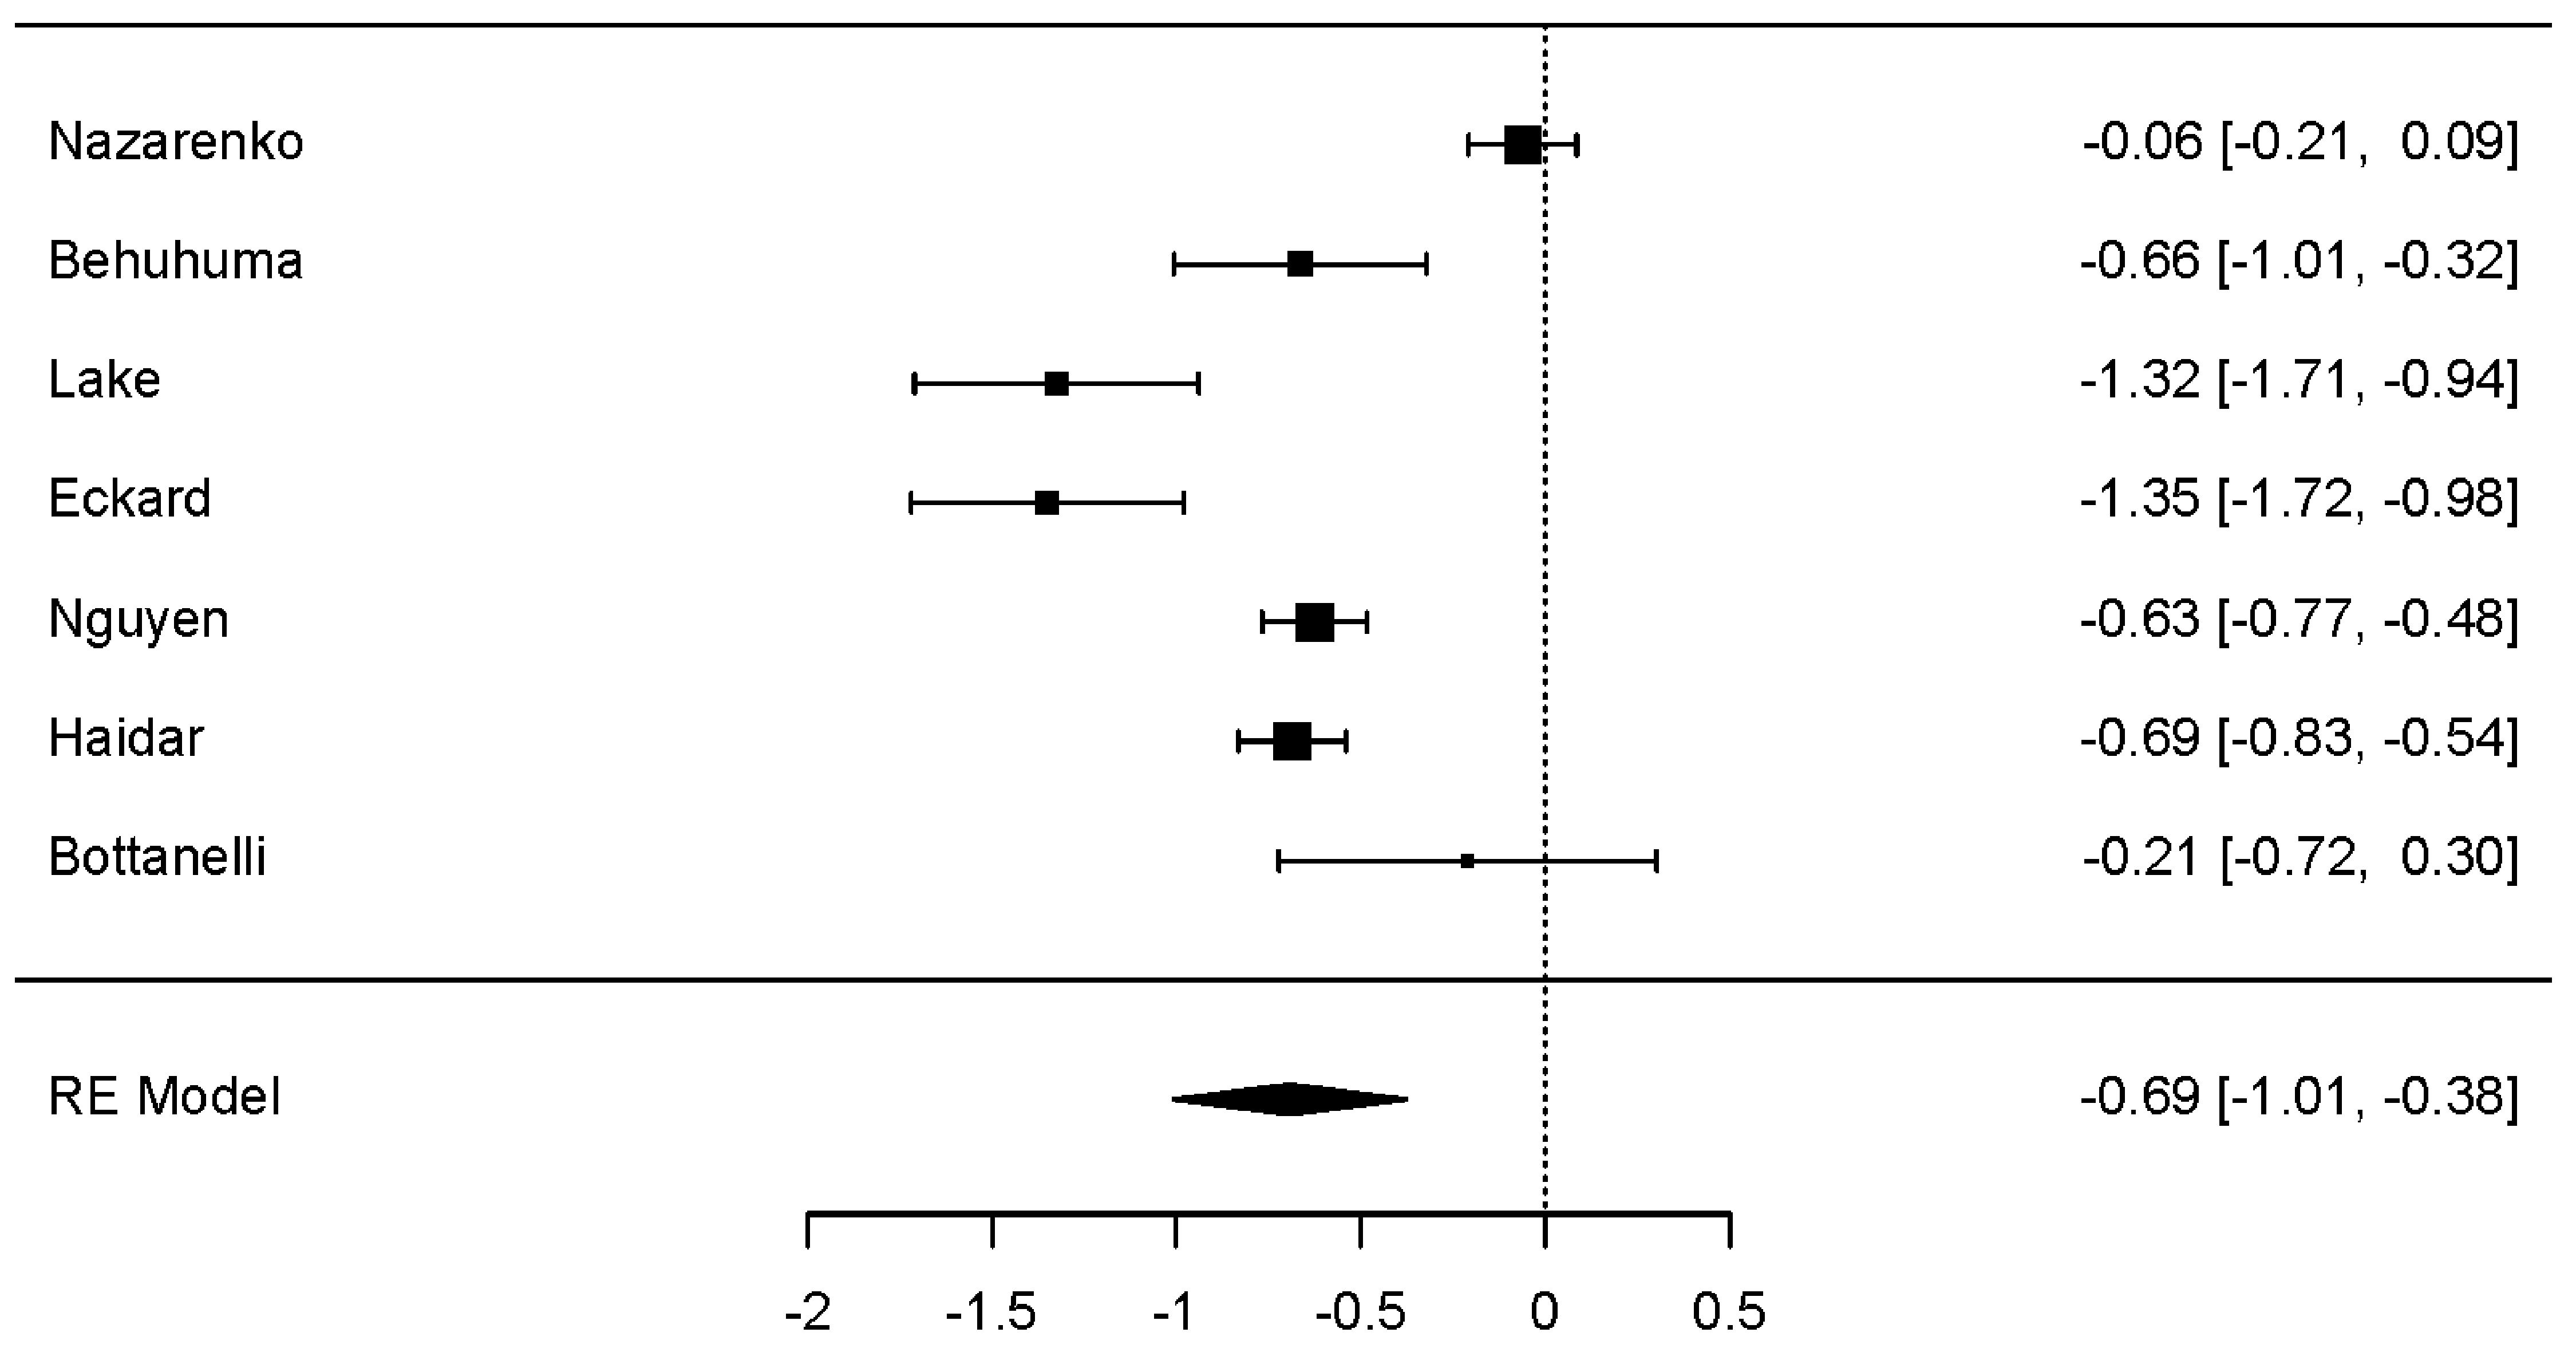
↓ Figure 2. Forest plot: BMI change. The forest
plot illustrates the random-effects meta-analysis model for BMI change associated with GLP-1 RAs among
people with HIV. Values are presented as effect sizes (dunbiased) and 95% confidence
intervals. HIV: human immunodeficiency virus; GLP-1 RAs: glucagon-like peptide-1 receptor agonists; BMI:
body mass index; RE: random effects.
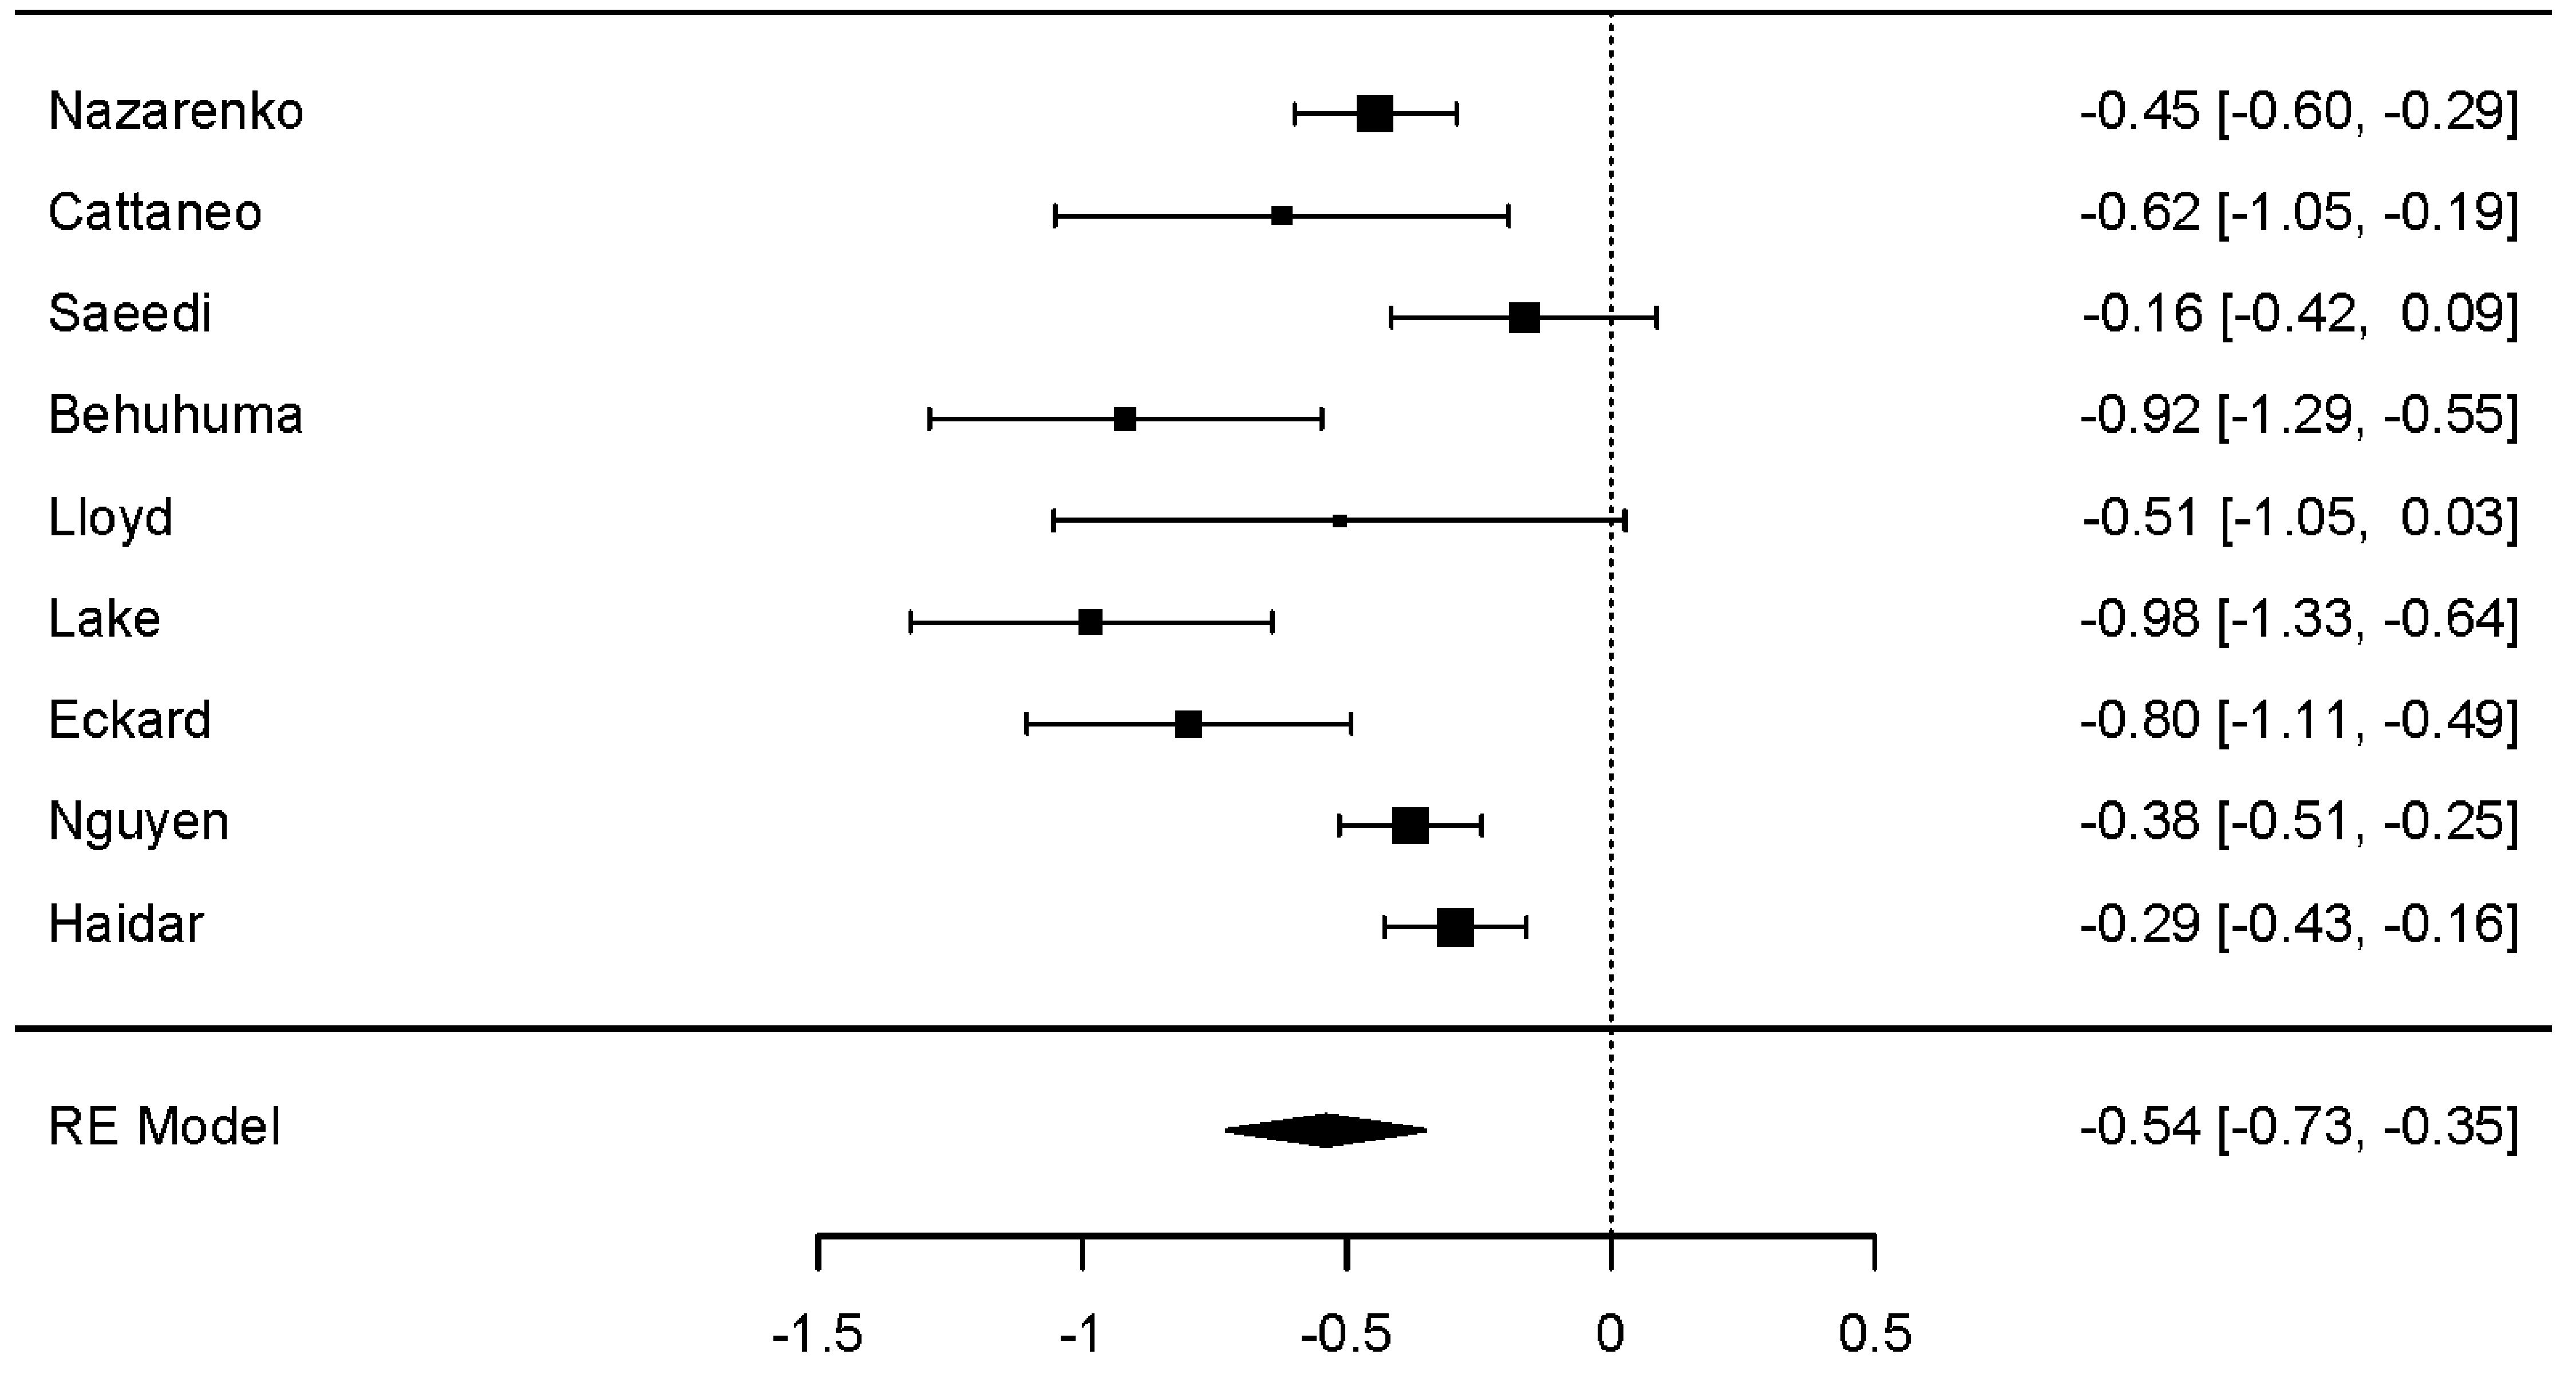
↓ Figure 3. Forest plot: HbA1c change. The forest
plot illustrates the random-effects meta-analysis model for HbA1c change associated with GLP-1 RAs among
people with HIV. Values are presented as effect sizes (dunbiased) and 95% confidence
intervals. HIV: human immunodeficiency virus; GLP-1 RAs: glucagon-like peptide-1 receptor agonists;
HbA1c: hemoglobin A1c; RE: random effects.
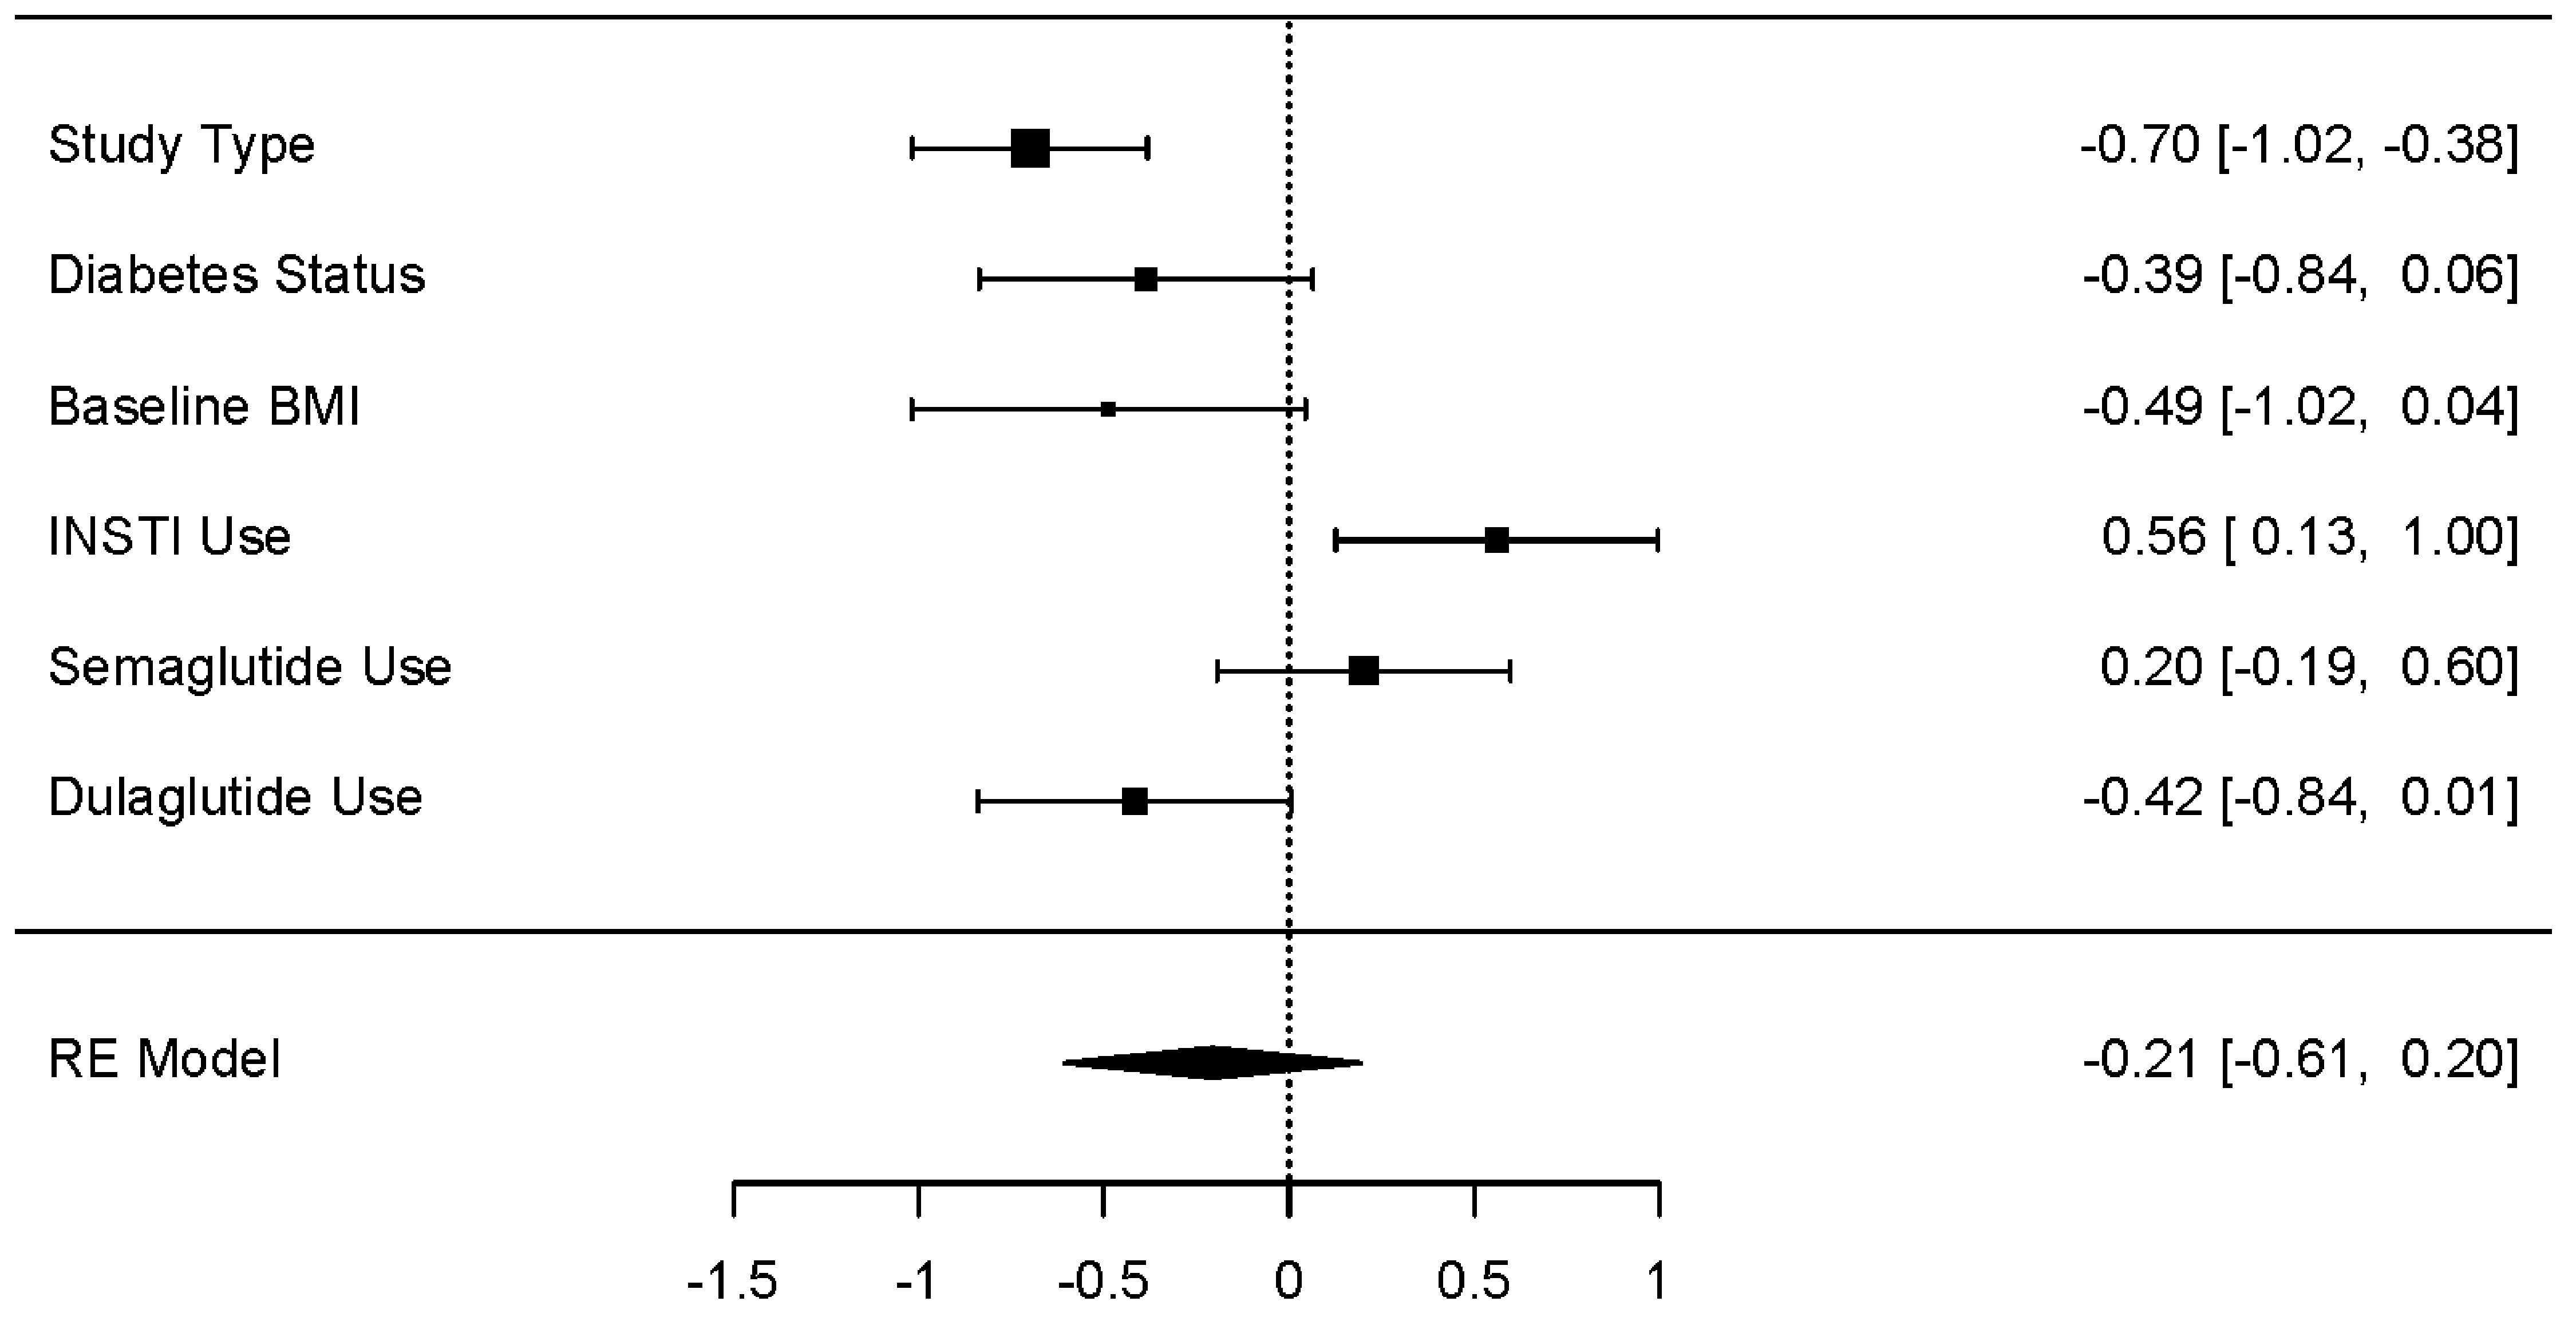
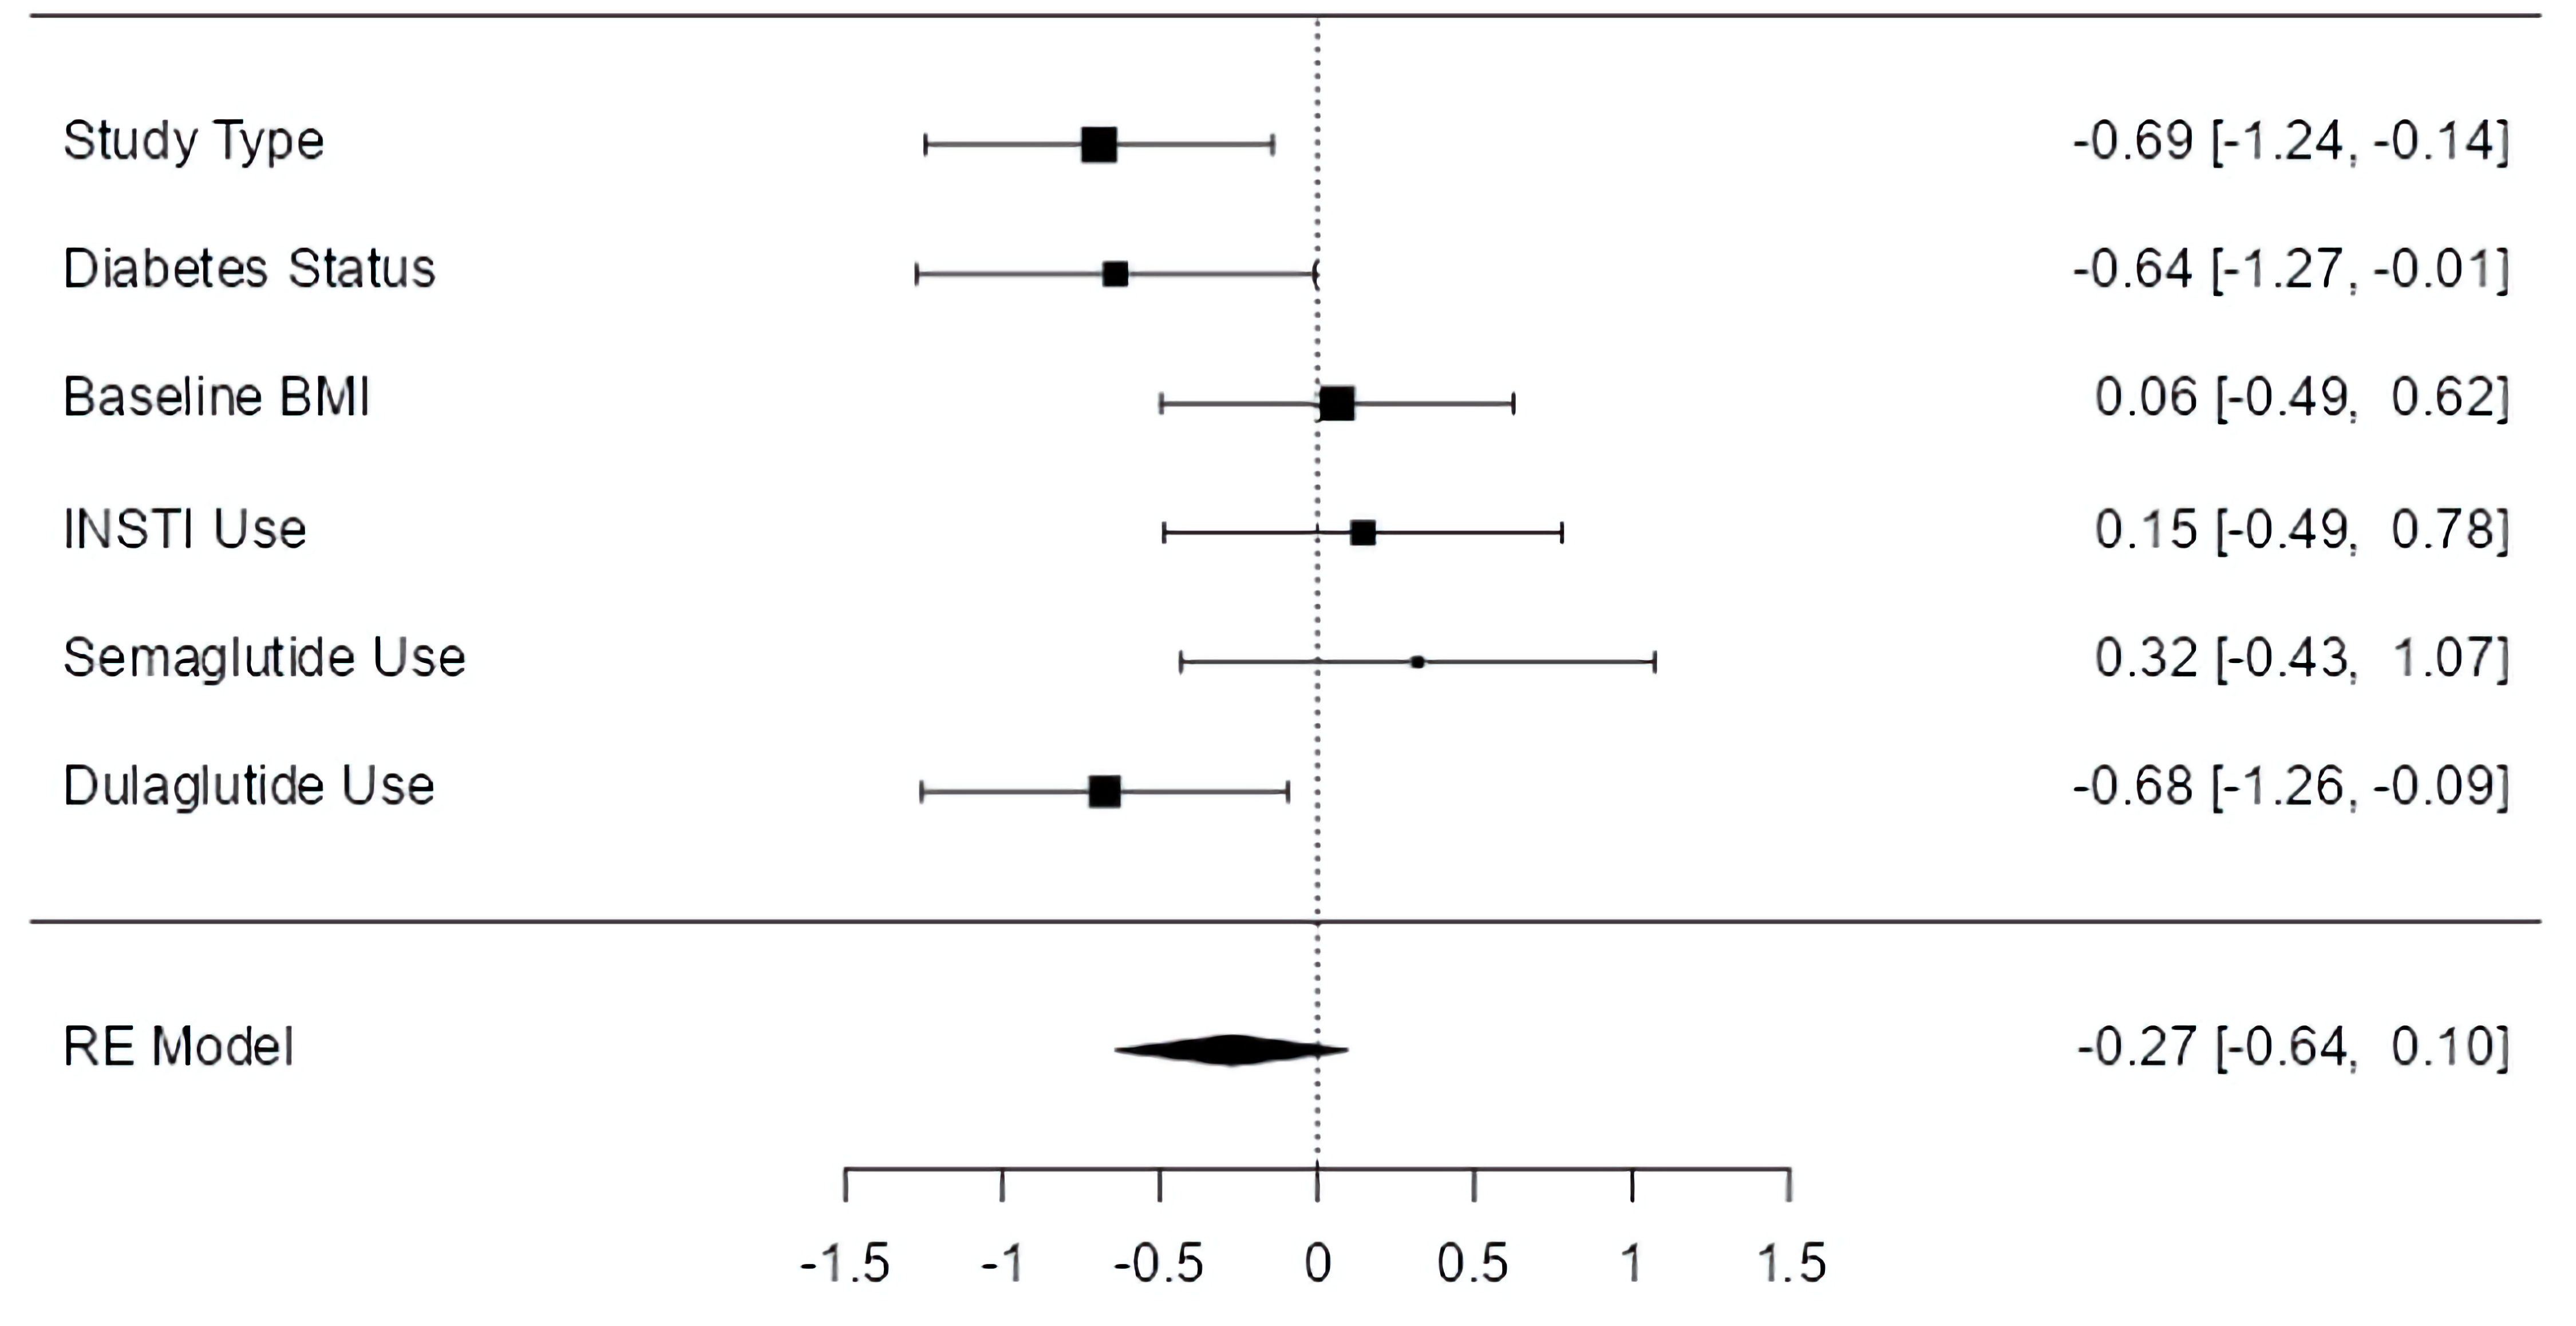
↓ Figure 4. Moderator effect sizes for weight
(kg). The forest plot illustrates the random-effects meta-analysis model for moderators of weight change
(kg) associated with GLP-1 RAs among people with HIV. Values are presented as effect sizes
(dunbiased) and 95% confidence intervals. HIV: human immunodeficiency virus; INSTI:
integrase strand transfer inhibitor; GLP-1 RA: glucagon-like peptide 1 receptor agonist; RE: random
effects.
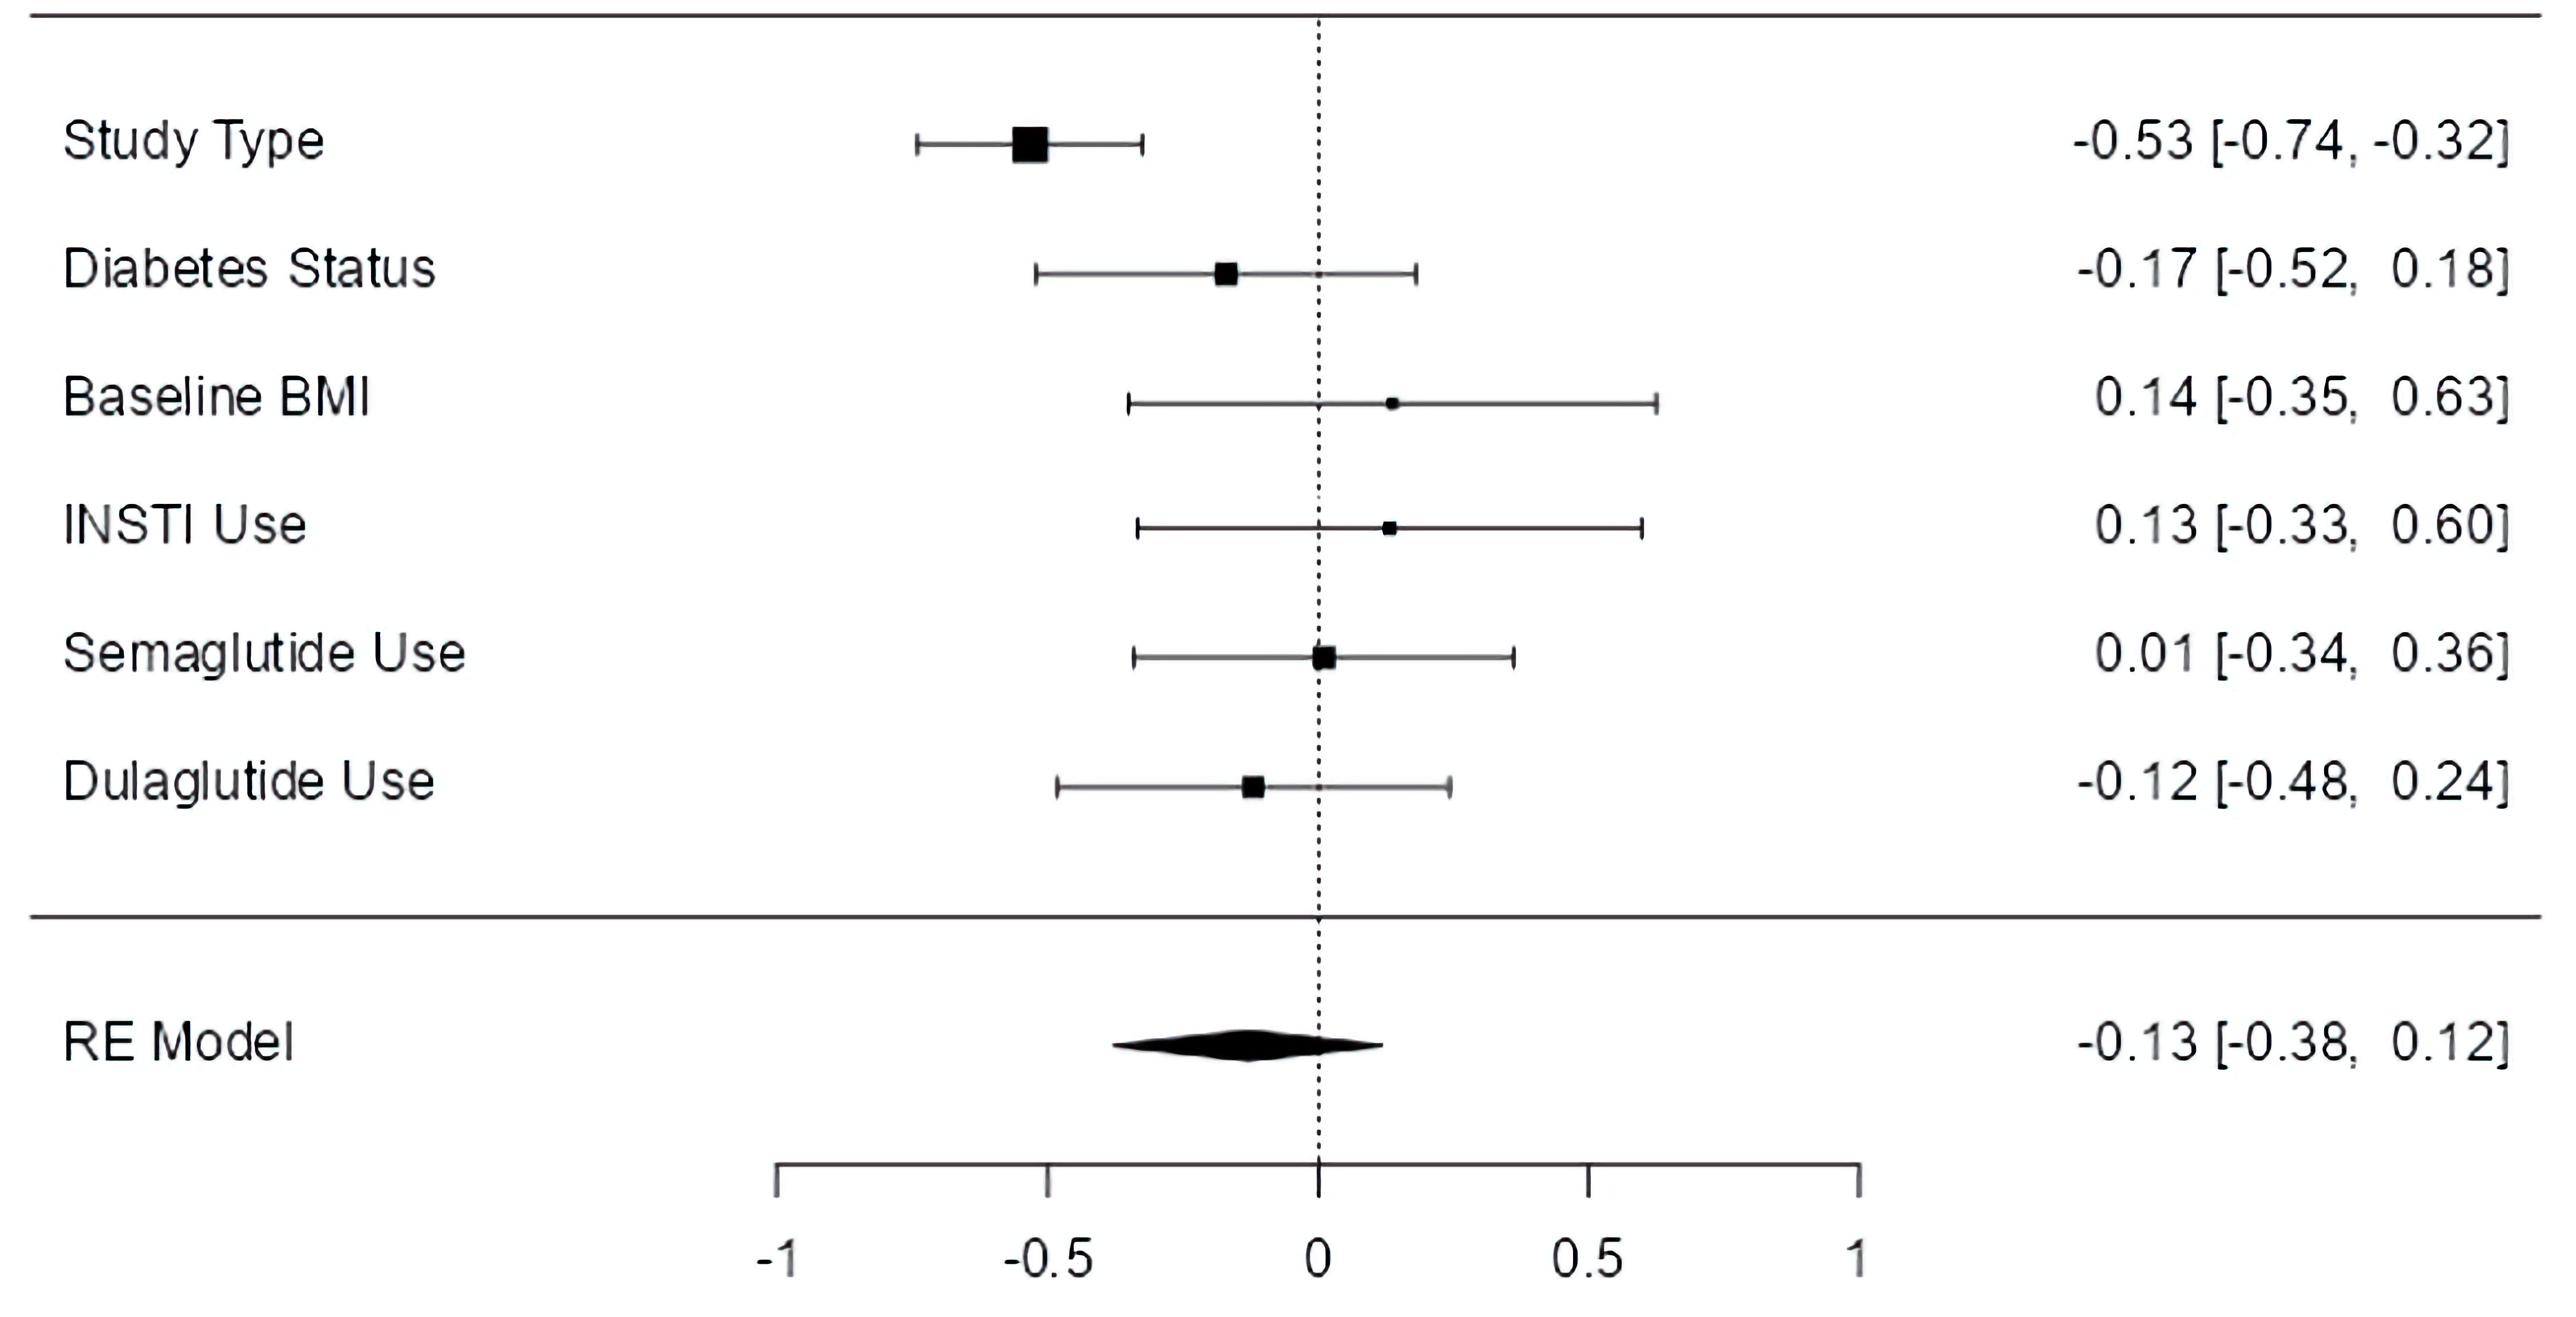
↓ Figure 5. Moderator effect sizes for BMI. The
forest plot illustrates the random-effects meta-analysis model for moderators of BMI change associated
with GLP-1 RAs among people with HIV. Values are presented as effect sizes (dunbiased)
and 95% confidence intervals. HIV: human immunodeficiency virus; INSTI: integrase strand transfer
inhibitor; BMI: body mass index; GLP-1 RA: glucagon-like peptide 1 receptor agonist; RE: random
effects.
↓ Figure 6. Moderator effect sizes for HbA1c. The
forest plot illustrates the random-effects meta-analysis model for moderators of HbA1c change associated
with GLP-1 RAs among people with HIV. Values are presented as effect sizes (dunbiased)
and 95% confidence interval. HIV: human immunodeficiency virus; INSTI: integrase strand transfer
inhibitor; BMI: body mass index; GLP-1 RA: glucagon-like peptide 1 receptor agonist; HbA1c: hemoglobin
A1c; RE: random effects.
Table
↓ Table 1. Characteristics of Included Studies
|
Study |
Nazarenko, 2024 [24] |
Cattaneo et al, 2025 [25] |
Saeedi et al, 2015 [26] |
Behuhuma et al, 2025 [27] |
Lloyd et al, 2023 [28] |
Lake
et al, 2024 [22] |
Eckard et al, 2024 [20] |
Nguyen et al, 2024 [23] |
Haidar et al, 2024 [21] |
Bottanelli et al, 2024 [19] |
| aControlled study. BMI: body mass index; CT: clinical trial; DG:
dulaglutide; EX: exenatide; LG: liraglutide; RS: retrospective study; SG: semaglutide; T2D: type 2
diabetics; TZ: tirzepatide; N/A: not available; INSTI: integrase strand transfer inhibitor; GLP-1
RA: glucagon-like peptide 1 receptor agonist. |
| Study type |
RS |
RS |
RSa |
CT |
RS |
CT |
CTa |
RS |
RS |
RS |
| Subjects with HIV |
180 |
25 |
62 |
40 |
15 |
49 |
54 |
227 |
222 |
15 |
| Duration (months) |
25.38 |
7.53 |
6 |
2.76 |
N/A |
5.5 |
7.4 |
13.9 |
12 |
12 |
| T2D (%) |
82.0 |
100.0 |
51.6 |
0.0 |
100.0 |
0.0 |
0.0 |
56.9 |
77.0 |
100.0 |
| Baseline BMI (kg/m2) |
N/A |
28.1 |
N/A |
39 |
N/A |
35.5 |
32.4 |
34.2 |
35.5 |
30.2 |
| Male (%) |
51.67 |
74.00 |
91.90 |
3.00 |
86.70 |
57.10 |
70.40 |
82.20 |
83.80 |
86.70 |
| Female (%) |
48.33 |
26.00 |
8.10 |
97.00 |
13.30 |
36.70 |
29.60 |
17.80 |
16.20 |
13.30 |
| Mean age |
58.2 |
65 |
55 |
38 |
56 |
50.7 |
50 |
54.1 |
52.8 |
58.1 |
| INSTI (%) |
N/A |
100.00 |
30.50 |
100.00 |
86.60 |
82.00 |
83.00 |
74.90 |
82.40 |
33.30 |
| GLP-1 RA |
SG 50.5%; LG 4%; DG 45.5% |
SG 32%; LG 8%; DG 52%; EX 8% |
LG 100% |
LG 100% |
DG 73.3%; SG 13.3%; LG 13.3% |
SG 100% |
SG 100% |
SG 59.2%; LG 3.1%; DG 30.7%; EX 0.9%; TZ 6.2% |
SG 100% |
SG 20%; LG 33.3%; DG 46.7% |