Figures
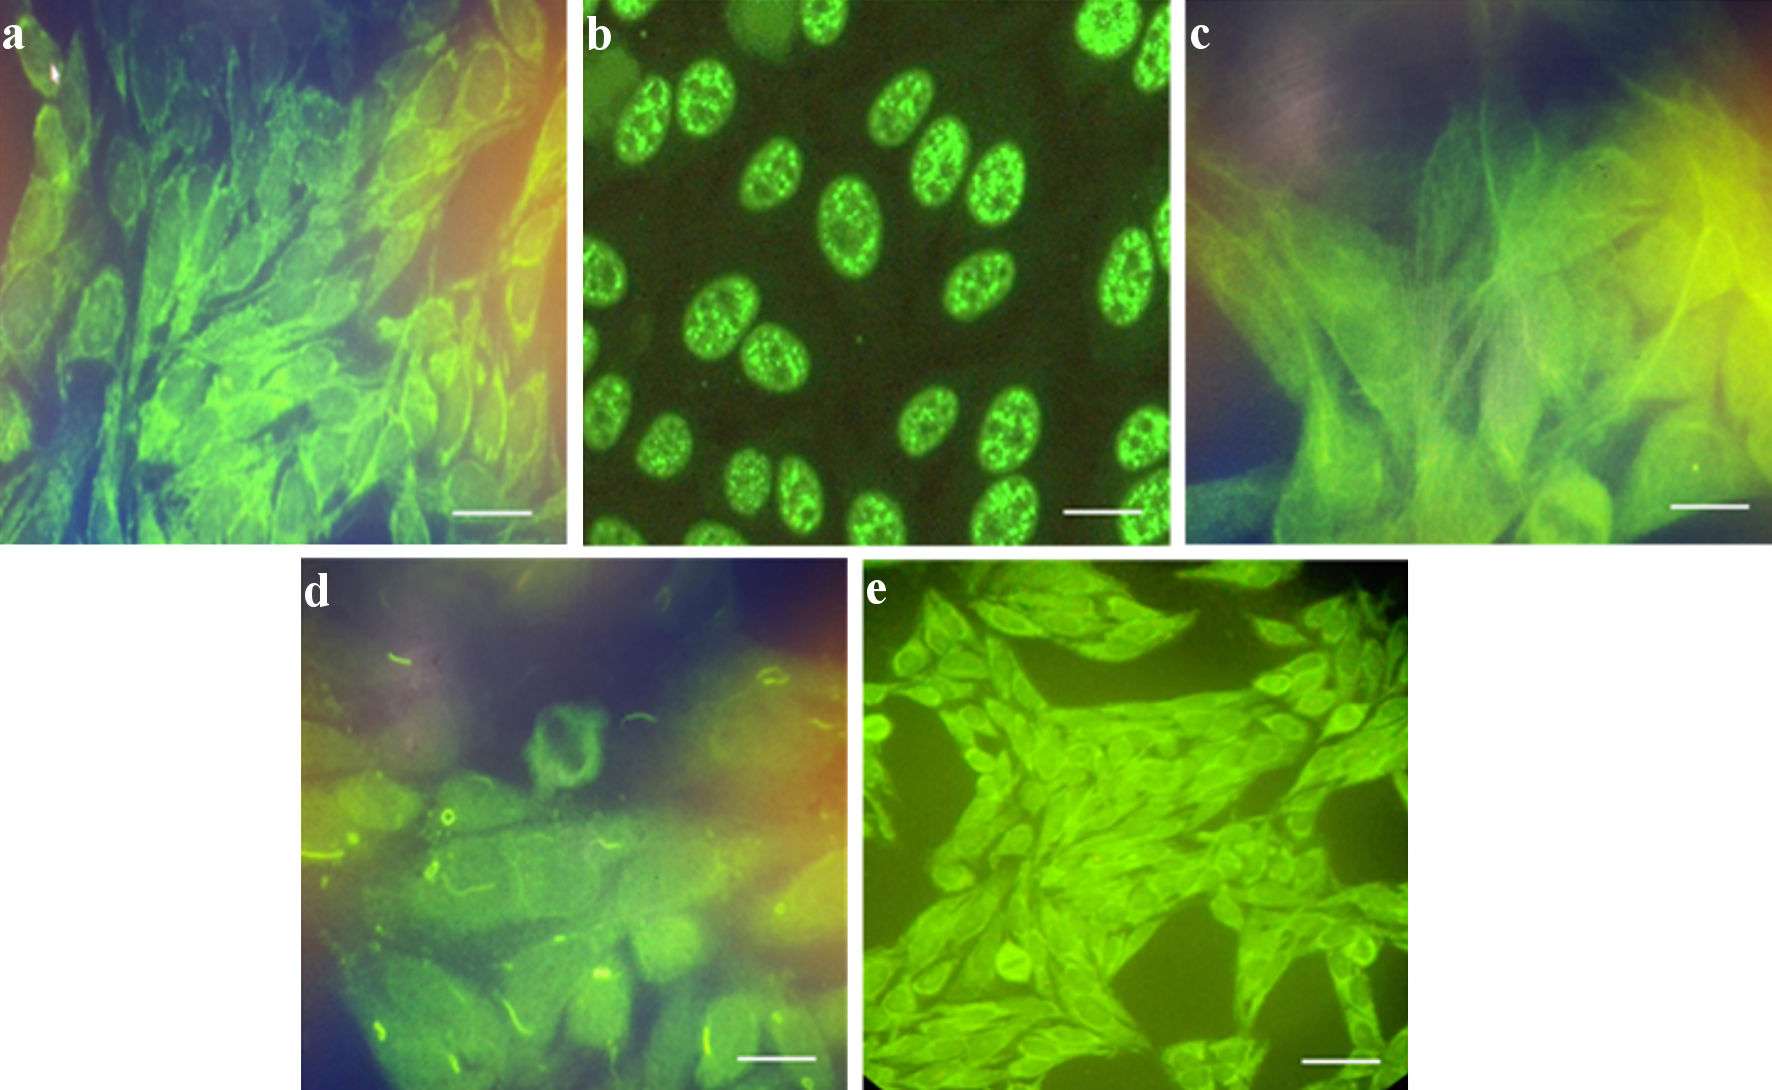
↓ Figure 1. Representative images of ANA patterns in positive sera from patients with malignant prostate disease (n = 8): (a) cytoplasmic; (b) speckled; (c) cytoskeletal; (d) rods and rings; and (e) mixed pattern. Mixed patterns of ANA included speckled, midbody, nucleolar, and other cytoplasmic fluorescence, which interfered with their detection. Scale bar = 100 µm. ANA: antinuclear antibody.
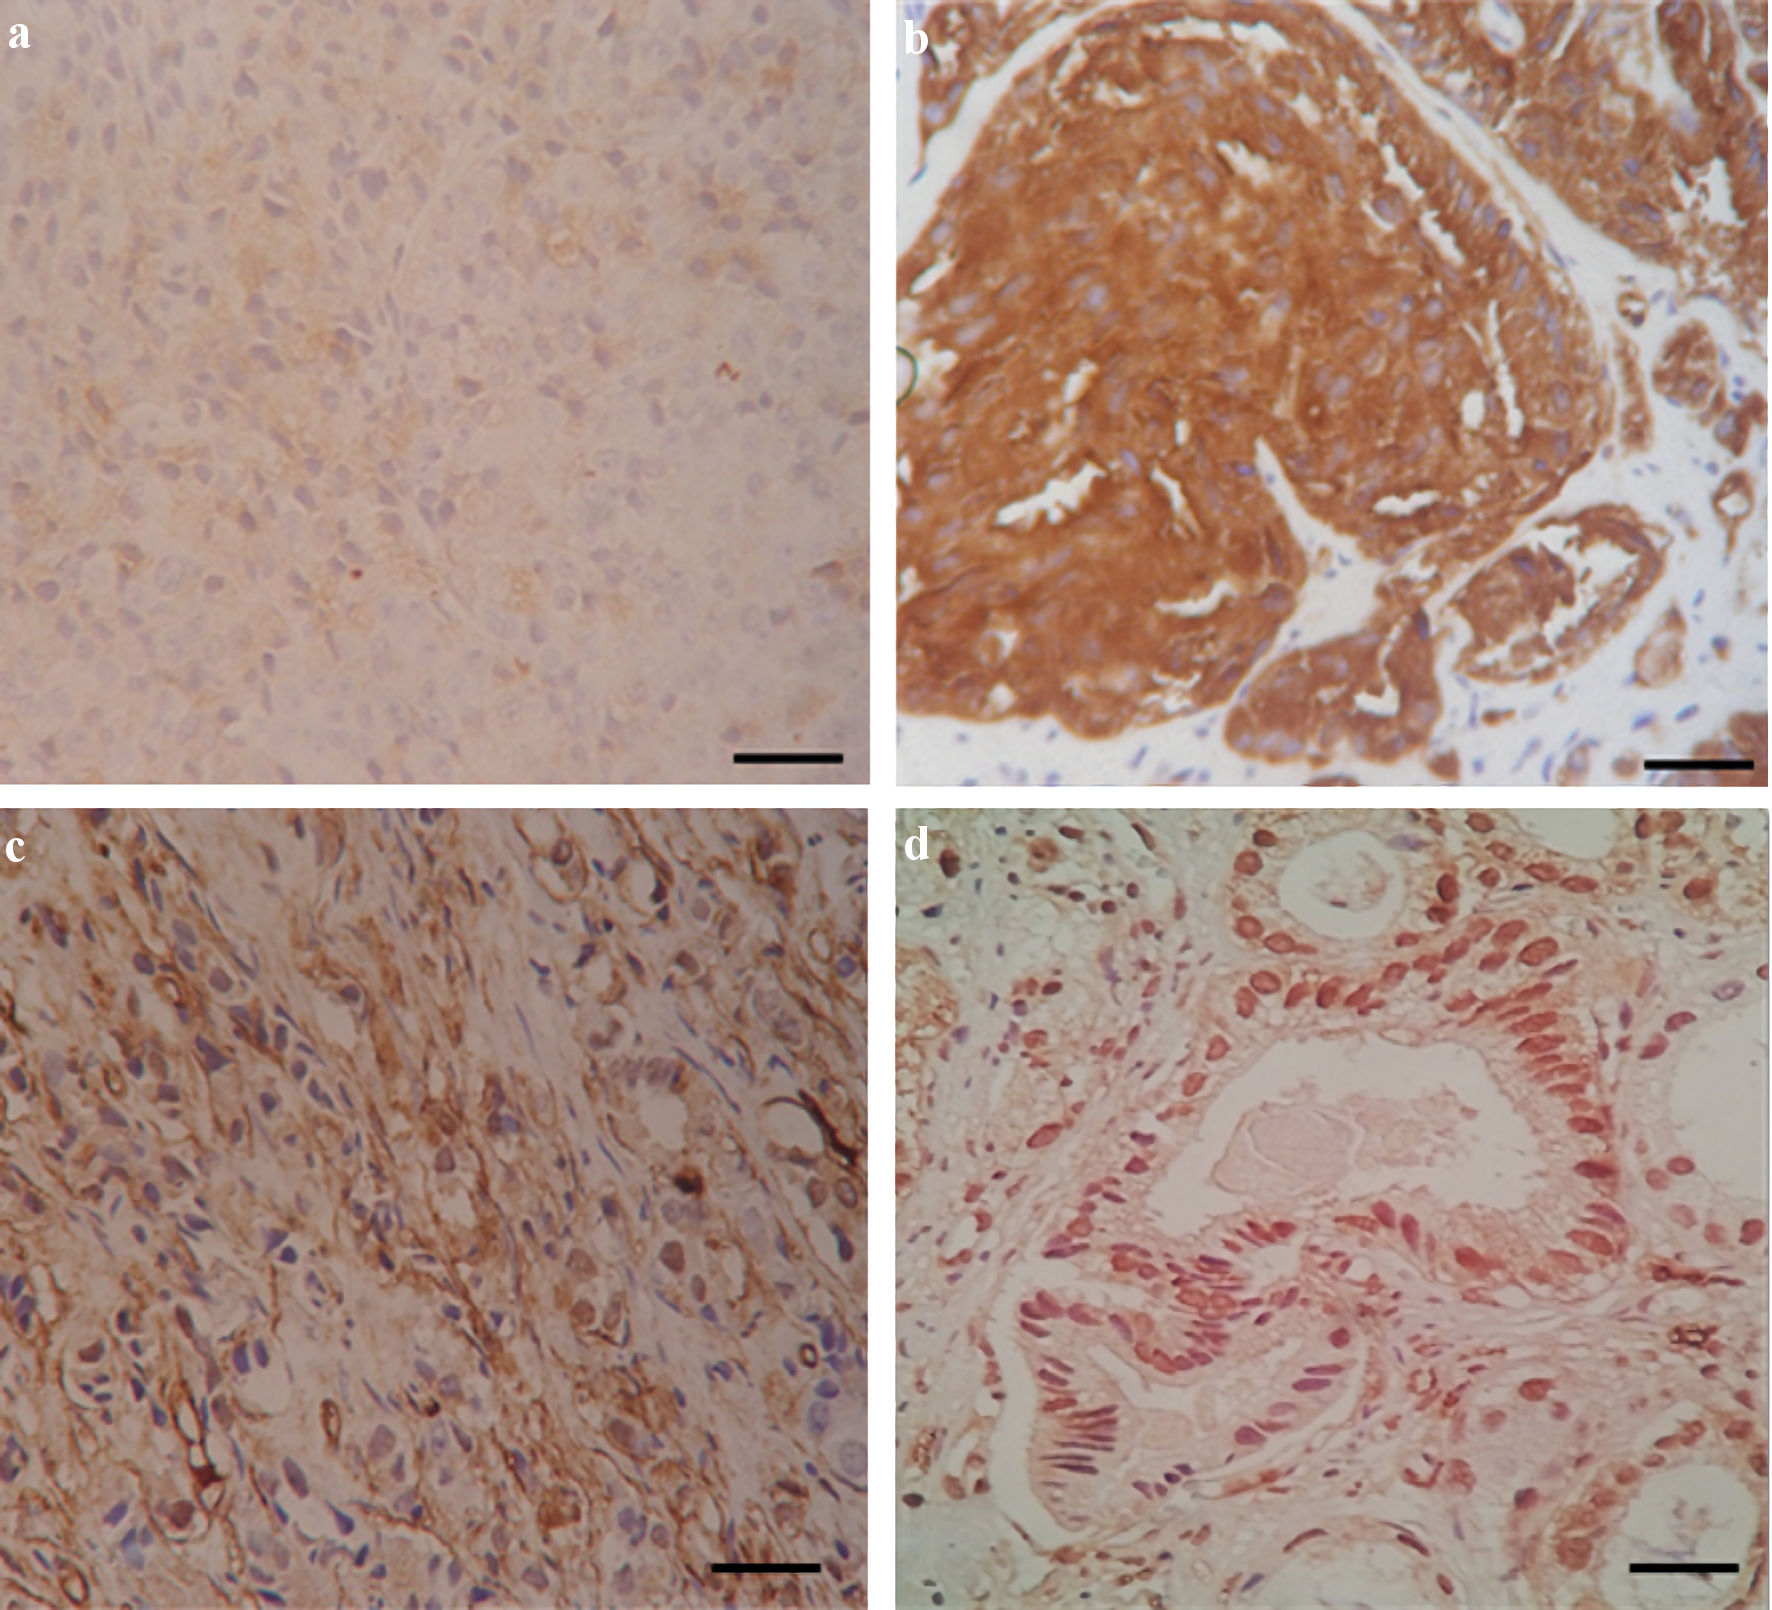
↓ Figure 2. Immunostaining of PSA, PSMA, CD34, and Ki-67 expression in human prostate cancer tissues (n = 26). (a) PSA shows low cytoplasmic staining. (b) PSMA has characteristic cytoplasmic but also strong membranous staining. (c) CD34 immunoreactivity is restricted to the blood vessels. (d) Ki-67 shows high nuclear staining. Scale bar = 100 µm. PSA: prostate-specific antigen; PSMA: prostate-specific membrane antigen.
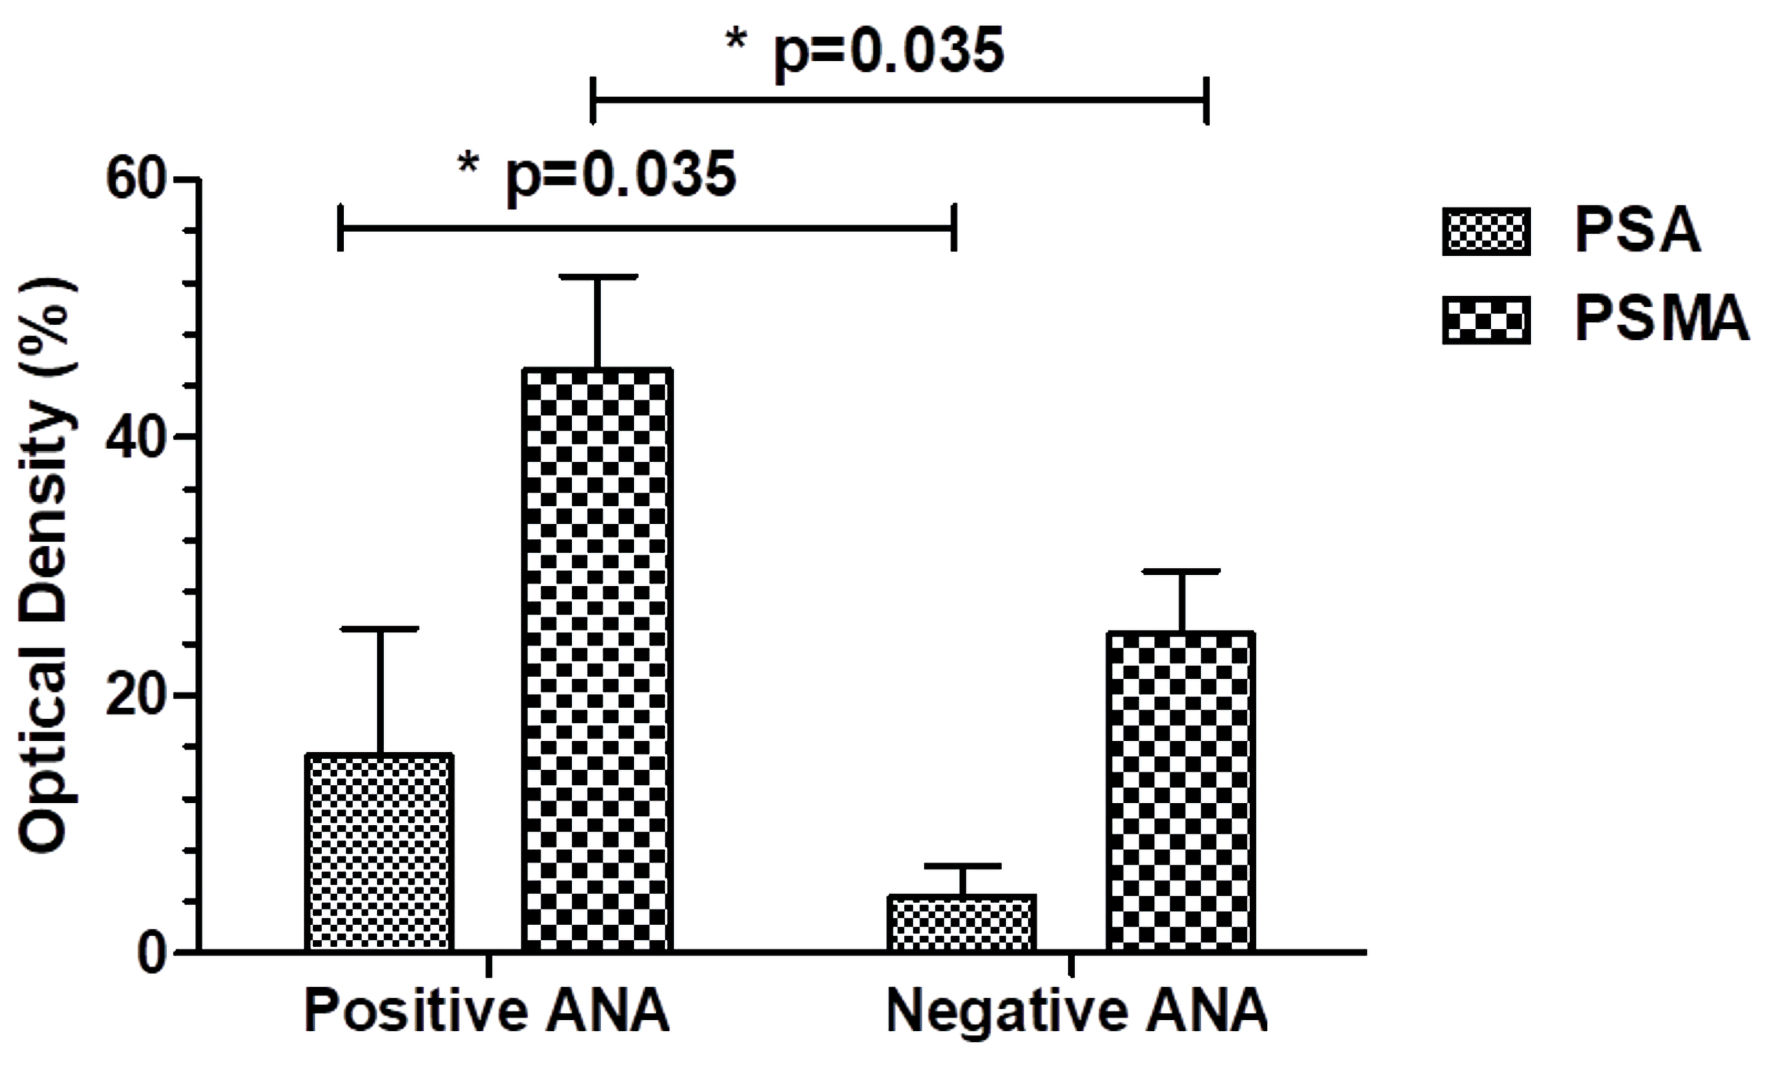
↓ Figure 3. Comparison of PSA and PSMA immunoreactivity in malignant prostate patients depending on the ANA positivity (positive ANA PCa patients n = 8; negative ANA PCa patients n = 18). *P < 0.05. ANA: antinuclear antibody; PSA: prostate-specific antigen; PCa: prostate cancer; PSMA: prostate-specific membrane antigen.
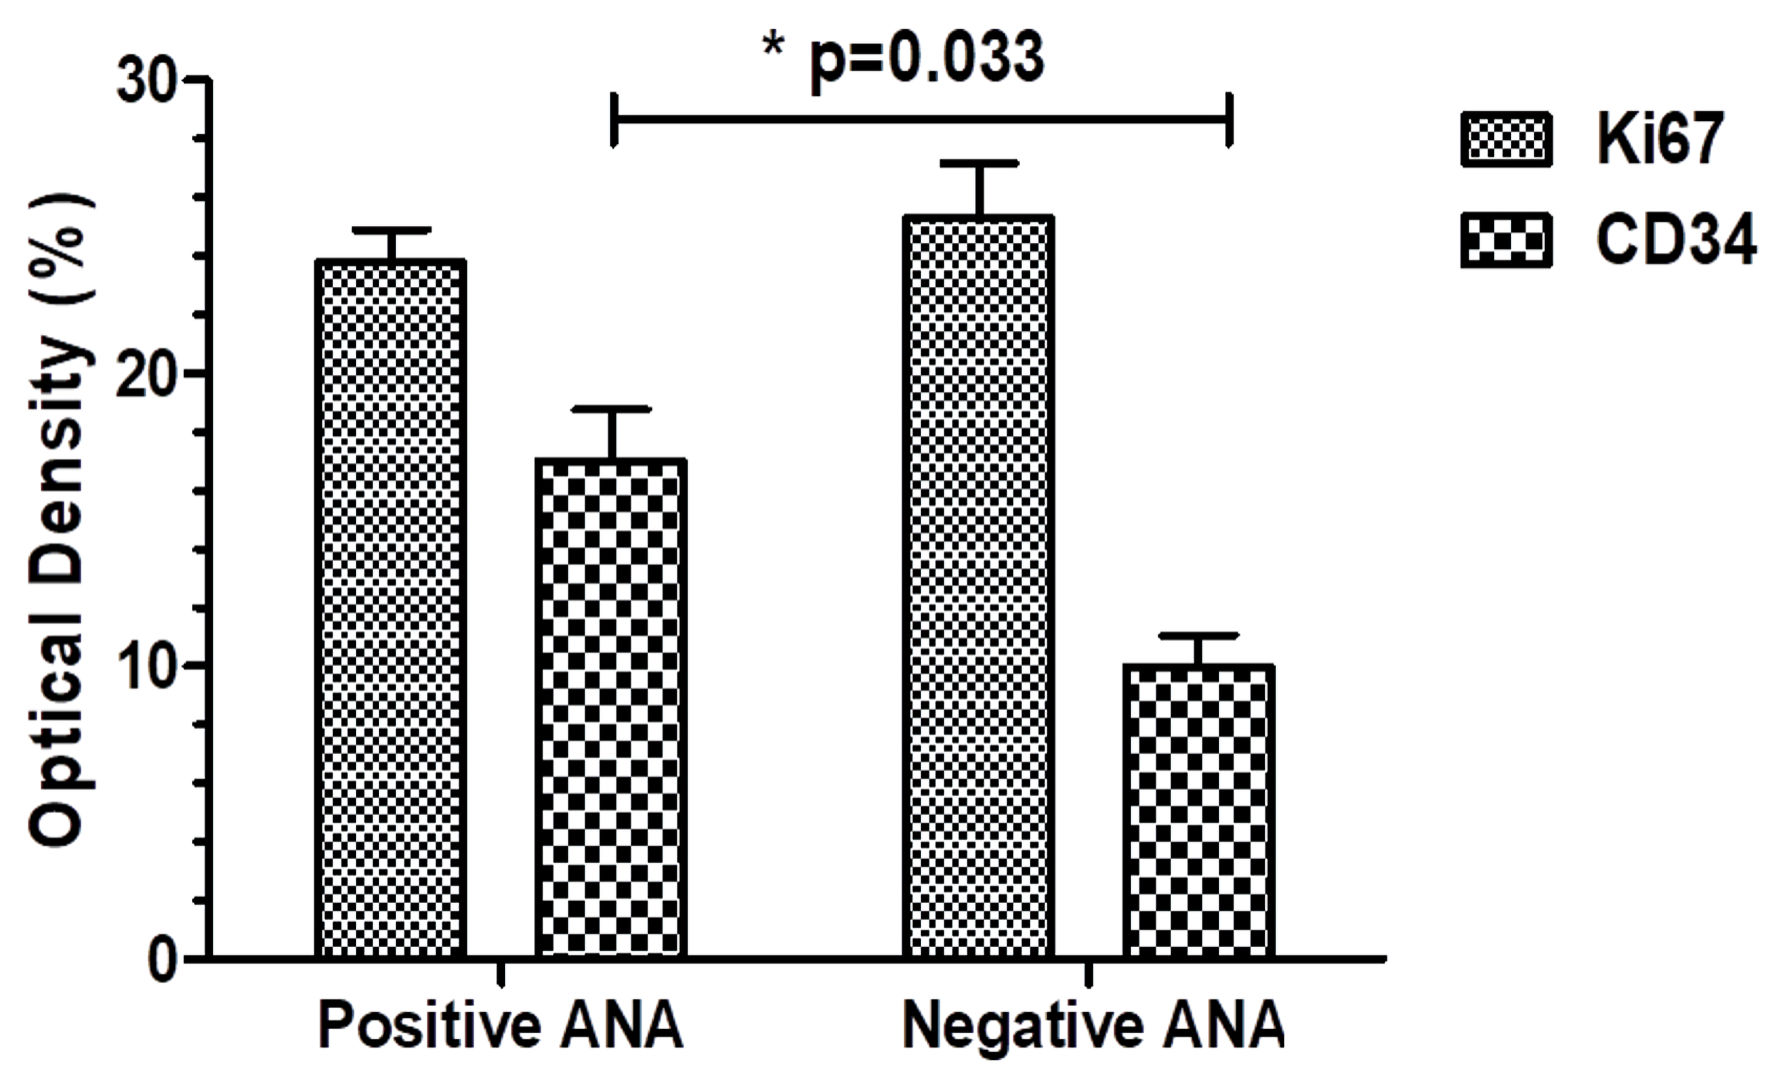
↓ Figure 4. Ki67 and CD34 immunoexpression among prostate cancer patients according to the ANA positivity (positive ANA PCa patients n = 8; negative ANA PCa patients n = 18). *P < 0.05. ANA: antinuclear antibody; PCa: prostate cancer.
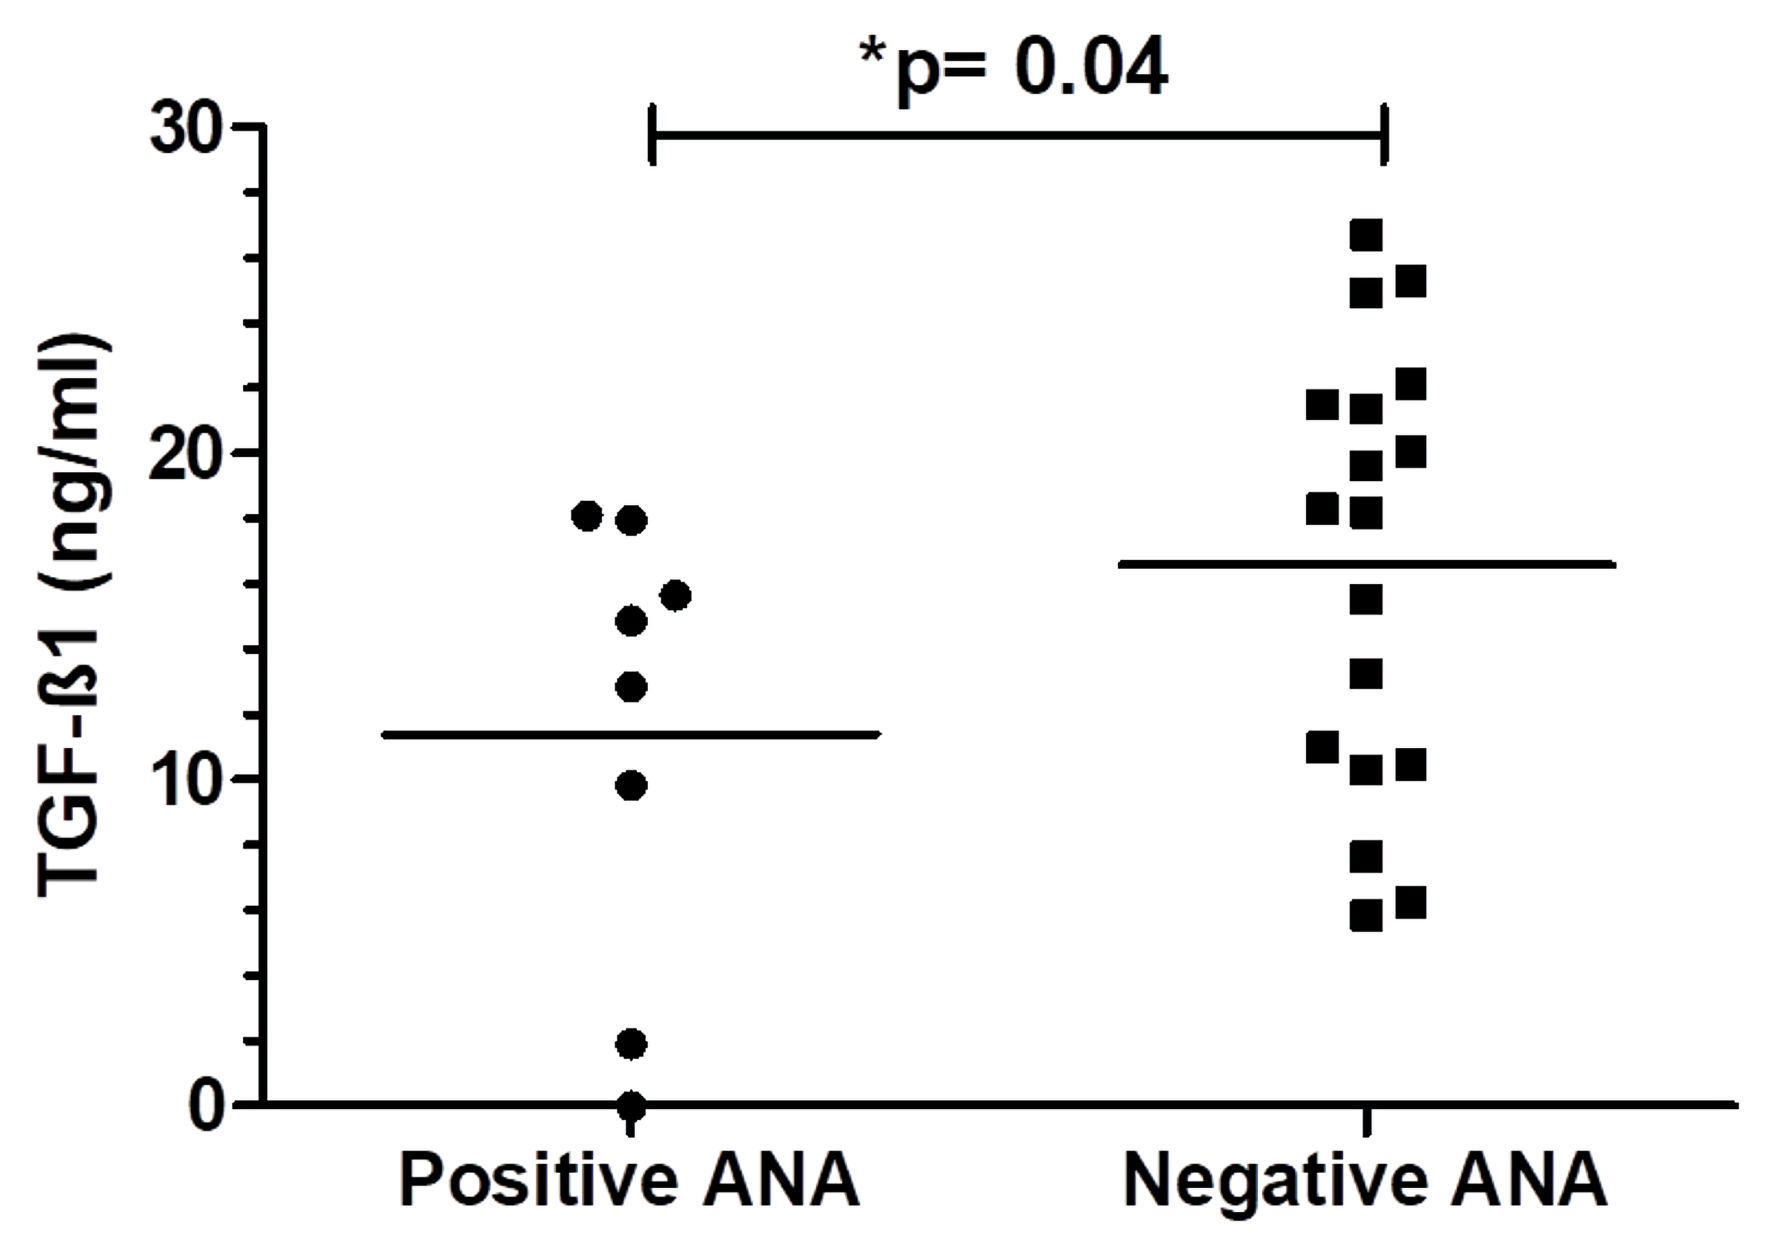
↓ Figure 5. TGF-β1 levels among prostate cancer patients depending on the ANA positivity (positive ANA PCa patients n = 8; negative ANA PCa patients n = 18). *P < 0.05. ANA: antinuclear antibody; TGF-β1: transforming growth factor β1; PCa: prostate cancer.
Table
↓ Table 1. Comparison of Malignant Prostate Lesions Characteristics According to Positivity of ANA (Positive ANA PCa Patients N = 8; Negative ANA PCa Patients N = 18)
| Characteristics | All patients (n = 26) | Positive ANA (n = 8, 30.8%) | Negative ANA (n = 18, 69.2%) | P value |
|---|
| ANA: antinuclear antibody; PCa: prostate cancer; PSA: prostate-specific antigen. |
| Age, median (range) | 74 (58–85) | 75 (68–83) | 75 (58–85) | 0.977 |
| Gleason score n (%) | | | | |
| < 6 | 0 (0%) | 0 (0%) | 0 (0%) | |
| 6–7 | 13 (50%) | 3 (37.5%) | 10 (55.6%) | 0.016 |
| 8–10 | 13 (50%) | 5 (62.5) | 8 (44.4%) | 0.433 |
| PSA ng/mL, median (IQR) | 80 (31.9–698) | 176 (83.5–1,203) | 51 (22.98–100) | 0.0046 |
| Hormone therapy, n (%) | 14 (53.9%) | 4 (50%) | 10 (55.6%) | 0.113 |
| Hormone escape, n (%) | 4 (15.3%) | 2 (25%) | 2 (11.1%) | 1.000 |
| Metastasis, n (%) | 2 (7.7%) | 1 (12.5%) | 1 (5.6%) | 1.000 |
| ANA pattern, n (%) | | | — | 0.485 |
| Cytoplasmic | 1 (3.9%) | 1 (12.5%) | — | |
| Speckled | 1 (3.9%) | 1 (12.5%) | — | |
| Cytoskeletal | 1 (3.9%) | 1 (12.5%) | — | |
| Rods and rings | 1 (3.9%) | 1 (12.5%) | — | |
| Mixed pattern | 4 (15.3%) | 4 (50%) | — | |